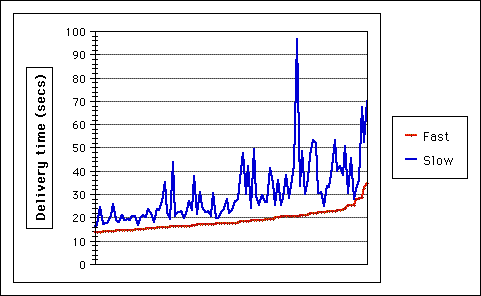
When talking about delivery performance, the average time per page tells only part of the story. Variability counts as well. This is easy to see if we calculate the averages for fast and slow pages, then look at the spread between them. For example, the chart below shows the spread for all the servers in the The Great Web Race.

The red line shows the delivery time for fast pages, and the blue line the time for slow pages on the same server. As you see, some servers are much more variable than others. The worst server in the Race, at a major online shopping site, shows up as a tall blue peak to the middle right of the chart. This server, a Sparc Ultra on a 3Mbps connection, was heavily overloaded. It could send the test page in the 14 seconds you would expect for a server in its class. It just didn't do it very often! Its spread between fast and slow pages was over 70 seconds.
People recognize fast and slow when they see it. For our delivery monitoring service, we had to come up with a number. After some experimenting, this is what we came up with. First we get the average for all page deliveries from a server. Then we average the deliveries that were faster than average. We call this the "fast" delivery time. Similarly, the "slow" delivery time is the average for deliveries slower than the overall average.
This kind of double averaging is not usually recommended in statistics textbooks. One "rogue" slow delivery will shift the "slow" average noticeably. In this case, we think this well represents how your clients see you server. One "rogue" slow delivery will stand out more in their minds than several on time deliveries.
Some obvious places to look are at our monitoring station and ISP, the Net backbones, and congestion due to daily "surges in demand". A previous study showed there is no correlation between hour of day or day of week and page delivery times. This is contrary to popular opinion, but nevertheless remains true.
Looking at the Web Race results, some servers could consistently deliver the test page within a couple of seconds. This places an upper limit of a couple of seconds for the variability due to our local site.
Fifteen percent of servers in the Race could deliver a page with a spread of under 4 seconds. These servers were scattered over a wide area. Even servers in Sweden and Malaysia could manage under 5 seconds. So the long distance connections are at most contributing a couple of seconds.
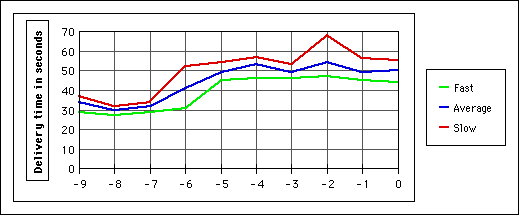
The average spread for all the servers in the Race was nearly 12 seconds. This is 3 or 4 times the spread for the best servers. Where does it come from? Taking a look at a typical OnTime Delivery Chart gives a clue:

This is a chart for one of the IBM URLs we monitor. It shows the results for the last ten weeks, with the most recent week at the right of the chart. As you see, the fast delivery time is quite constant, except for a change five or six weeks ago. The slow delivery time varies from week to week, but the fast time only changes when there is a change at the site, such as a change in page size.
We believe the fast time shows what the site is capable of. The slow times are delays due to load on the site. Another chart illustrates the point.

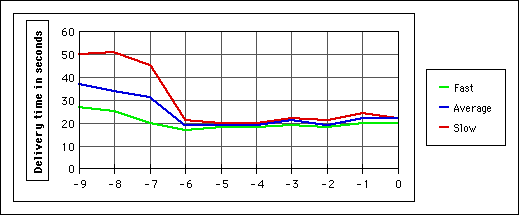
This chart is for International Thomson Publishing. As you can see, delivery performance improved remarkably about six weeks ago. The spread between fast and slow pages dropped from about 25 secs to about 2 secs. When asked what changed at this point, ITP replied:
"We went from a customized HTTP server running on a Sparc 20, SunOS 4.1.3 to a Sparcserver 1000, dual processor running Solaris 2.4, Netscape Commerce server HTTP server."
This and other examples shows that hardware changes at a site strongly effect the spread. If the variations were coming from congestion on the Net, or on our local monitoring site, this wouldn't happen. So we believe the variation for most sites comes for load in the site.
So what is "Load"? To be strictly accurate, its what is left as a cause of variation, when all other factors are eliminated. This "Factor X" we know is not due to congestion at our receiving site, nor to congestion on the Net as a whole. It affects some powerful servers on fast connections, but some small servers on slow connections are not affected. Adding a lot of new hardware can make it go away.
A reasonable conclusion is that this Factor X is traffic on the web site. In other words, load. We can't measure this directly, but we did note that some small servers in the Race supported home pages with access counters. The servers that did well showed low access counts. In contrast, a small server that claimed high traffic had a large spread.
Its not surprising that high traffic will slow down a server. What did surprise us was that, for most servers, this is the main factor determining page delivery time. We had expected speed of net connection or power of CPU to determine the likely range of delivery times.
We are not unhappy with this result however. It means matching your load to your server has a big payoff. Oh, and did we mention, a good first step to this is a subscription to OnTime Delivery?....