During June and July 96 we used spare capacity on our OnTime Delivery monitoring network to monitor over 100 web sites in a dozen countries. These sites had all loaded our standard test page onto their server, and added details of their site configuration. The sites had responded to a posting in the web server newsgroups to take part in The Great Web Race. For their trouble, contestants got a free ranking of their server performance. For our trouble, we got a unique view of real world server performance.
We were looking for some real world answers to frequently asked questions about Web Server Performance. We surveyed the following factors:
Our test page consisted of a 2K text file, and a 30K jpeg file. This is a fairly typical size for many of the pages we monitor. Our research has not shown a large difference between sending one large file or several smaller ones. This page was delivered on average in 22.6 seconds. The average for fast pages was 19.1 seconds, and for slow pages was 30.9 seconds. See Fast, Slow, Spread and Load for a description of these terms.
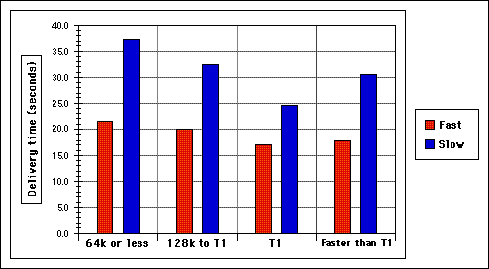
For fast pages, delivery time was about 4 seconds faster on a "T1" than on a "64Kbs or less" connection. About half this speed increase came from the change in server mix. The servers on slow connections tended to be small.
For "Faster than T1" connections the "fast" average goes back up. This was due to a cluster of slow Intel boxes on fast University lines. The upswing is even more marked for "slow" pages. The "slow" average was pushed up by several large commercial servers on fast lines that were heavily overloaded.
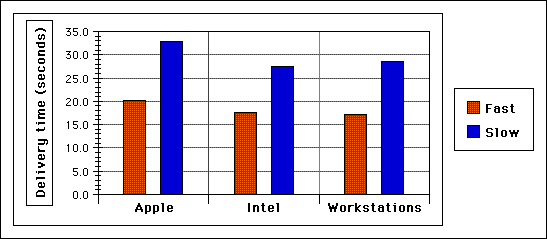
There were not enough samples for a detailed breakout by server model. Here are the averages for Apple, Intel and Workstation servers. Note that the Intel boxes performed as well as the average workstation. In fact they were better on slow pages. The Intel figures were improved by a cluster of Intel boxes on fast University backbones. The workstation figures were dragged down by some heavily overloaded commercial servers. See Fast, Slow, Spread and Load for more on this.
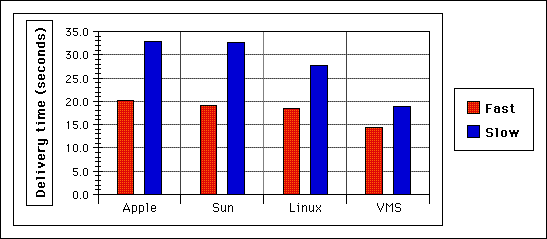
There were not enough samples to compare various operating systems on the same hardware. The performance figures for the most common OS in the survey are shown, and likely reflect the underlying hardware. Again the Linux figures were improved by a cluster of Intel boxes on fast University backbones. In contrast the Apple servers include a bunch of home machines on ISDN lines.
The small cluster of DEC machines running VMS performed well. Two came first and second in our "Web Race". All were on T1 lines or better. They show the small variation in delivery times that is possible when a site is well matched to its load.
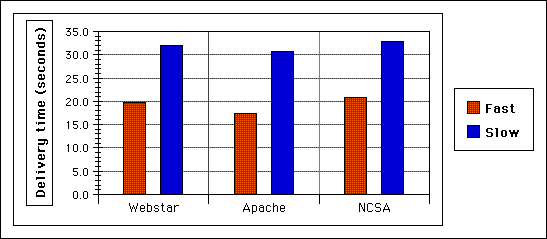
Server software. The sample wasn't big enough to analyze software performance on comparable machines. Most of the Macs were running Webstar. The Apache and NCSA software was running on a wide variety of hardware and underlying OS.
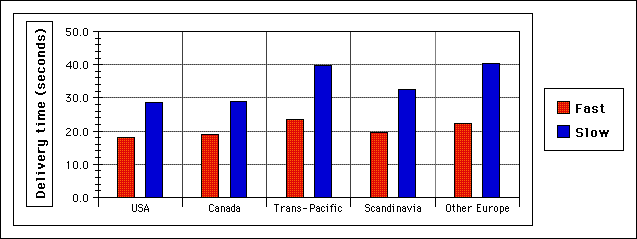
Transpacific and Transatlantic sites performed less well than North American ones. Partly, this is explained by a mix of slower servers and slower net connections, but there seems to be about a 2 second extra delay across the Atlantic, and 3 seconds across the Pacific. This is consistent with the figures for one of our OnTime Delivery clients. The science journal, Nature, has mirror sites on both sides of the Atlantic, and we see about a 3 second difference there for a 30 second page.
The Scandinavian servers performed significantly better than the rest of Europe. A couple of servers in Norway and Sweden performed as well as most anything in the USA.
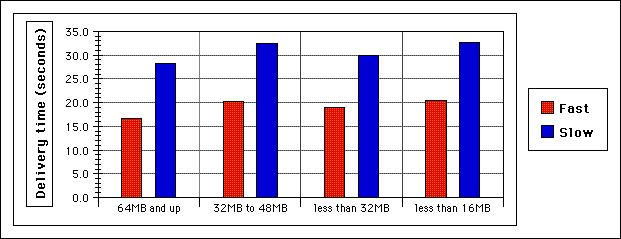
There was no discernible relationship between server RAM and delivery speed. Servers with over 64MB of RAM were significantly faster, but these were all powerful machines in other respects as well. Even servers with less than 16MB, as a group, performed quite respectably.
The overwhelming factor in delivery performance is server load. Most servers in our survey could deliver fast pages some of the time, and some servers could deliver fast pages most of the time. If the load is appropriate, a small server performs just fine. Under a large load, even a large server and Net connection will give poor results.
Our Server Configuration Guide indicates the delivery times you should expect if your site is performing well. In calculating the delays for various factors, we did not use the raw averages in the report above. We split out the contribution of various factors for use in the Guide.
When looking at the delay due to a slower connection, for example, we first removed overloaded servers. Then we looked for clusters of comparable machines on different speed connections. This gives a 2 second difference for ISDN to T1 connections, not the raw 4 seconds shown on the chart. Our results are only approximate, so are given rounded to whole seconds.
Last updated 5th Sep 96 by td@timedancer.com.